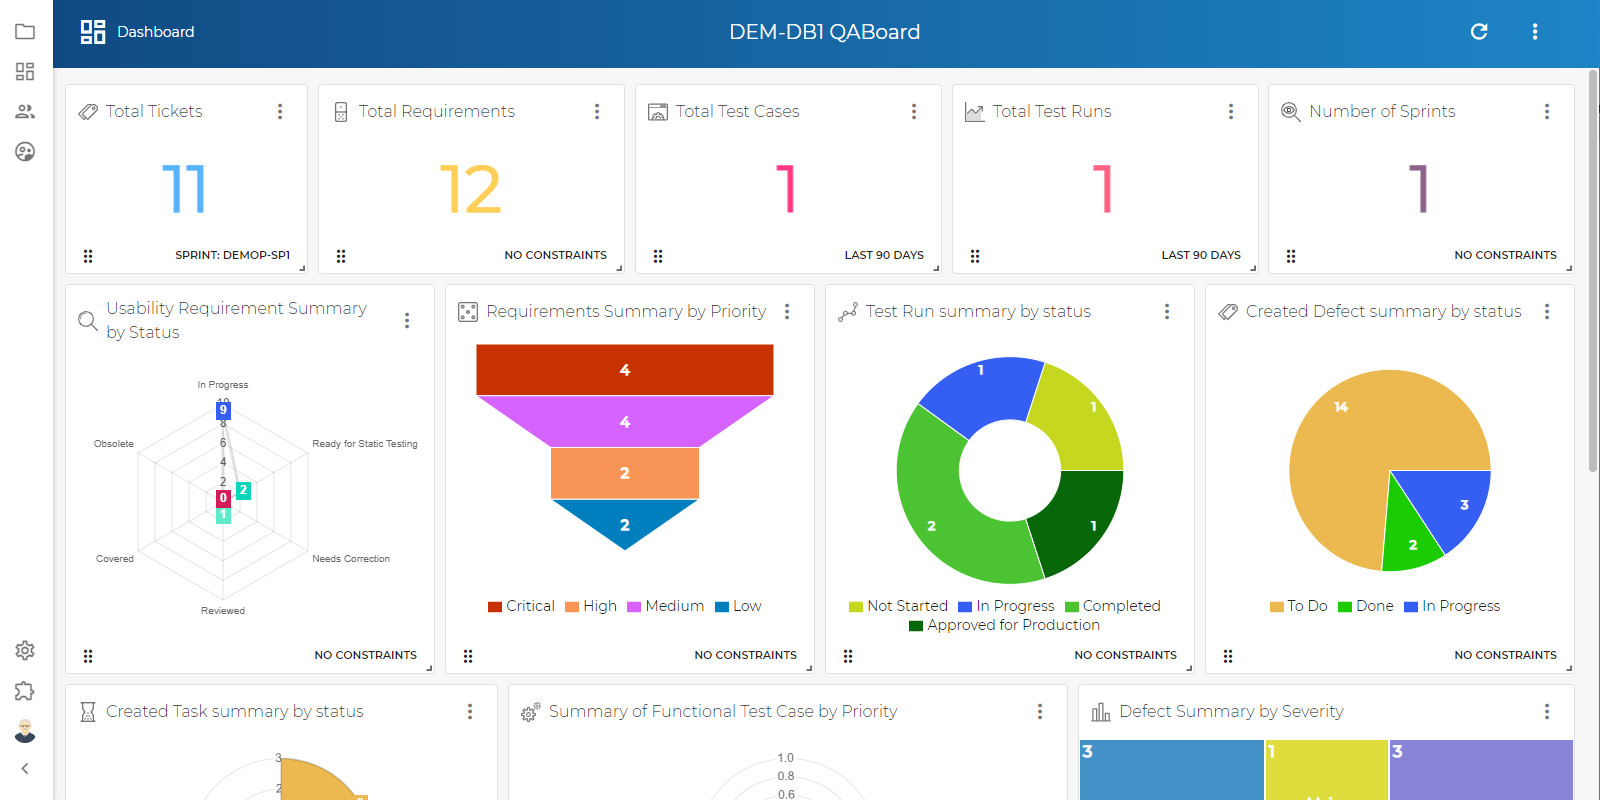
Dashboard & Reporting
Why you need the Reporting and Dashboard Module ?
Ability to export multiple graphs into various report formats
Ability to control reuqirements, tickets, test design and test execution cycles and obtain detailed and comprehensive analysis
Monitoring capabilities for actual execution percentage completion against planned estimates
Ability to see complete requirements coverage and overall release readiness based on passed test cases
Ability to monitor tester’s productivity based on test design and test execution reports
Key Features and Benefits
- Quick visual insights into work progress
- Multiple reports to cover all aspects
- Varied report types – grid, graph, and charts
- Ability to print or download in multiple formats
- Ability to zoom in to see detail more easily
Numerous Reports to Give Full Insight
Many Test Management solutions give you just one or two reports, but with QA Coverage, you get ten different reports to give you a complete perspective of the quality assurance progress and the activities of your QA team.
Requirements Coverage Summary Graph
Linked vs. Not Linked – pie chart that shows percentage of requirements linked and not linkedam can start static testing of finalized requirements.
Test Cases Progress Execution Dashboard
grid that shows test runs, progress, and status
Defects/Issues/Risks Require Your Attention
Grid that shows list of defects types, summary, and statuses
Requirements Summary Graph – last 7 days
Graph shows # of requirements created each day of the last 7 days
Test Cases Summary Graph – last 7 days
Graph shows # of test cases created each day of the last 7 days
Test Runs Summary Graph – last 7 days
shows the number of test runs created for each day of the last 7 days
Test Execution Summary Graph – last 7 days
Graph shows # of test cases executed each day of the last 7 days
Test Cases Summary Graph – by Priority
shows the total number of test cases of each priority
Requirements Summary Graph – By Type
Shows the total number of requirements of each type

